Test-driving Shiny with CouchDB (and RStudio)
The idea of Rapid Application Development is not exactly new. And, as I see it, many attempts have turned out rather annoying (much worse than having to develop more myself: necessary hooks for code to tweak the remaining 10% are just missing every time. And all the cluttered code…).
But let’s face it: the demos look amazing (and there is still a point to not repeating basic plumbing). With all that in mind, I gave Shiny a try. While at it, I also went from R Console plus vim to RStudio (the open source edition). This is not a requirement (the R Console would do), just curiosity. As I’m a fan of CouchDB, a JSON-document-oriented, distributed, web-technology-powered open source database with an amazing community around it, I used CouchDB as data store.
My test case is a todo list app (I know, I’m the very first): One can view how many tasks are open VS done, check off existing and add new. So, there is both visualization and interaction involved.
How it works, anyway
Shiny runs within R and essentially sets up a webserver. This webserver provides my app to anyone who would connect. What I have to do is specify two things:
- a breakdown of the screen (called ‘ui’): the ui defines like a flowLayout with a verticalLayout and a plotOutput, the verticalLayout containing some checkboxInputs as well as a textInput and an actionButton. All overall, this resembles many other UI frameworks back to TCL/TK.
- some specs on the logic that should be performed upon a new user connecting to the app and upon subsequent actions (like inputs changed or buttons clicked). Shiny calls this ‘server’.
Consequently, Shiny starts up by calling shinyApp and passing a ui (the result of the uppermost creator function, e.g. calling flowLayout) as well as a server (a function accepting input, output and a session). As soon as shinyApp was called, it never returns. Per se, this is what servers do - but for developing outside RStudio (and its Stop button), there is a mitigation available on Stackoverflow (suited for dev only, but sufficient).
The server function provides data to the ui (like plots) and reacts on actions (like buttion clicks), possibly providing new data to the ui. The whole idea is that after very few lines to construct the ui and another few lines in server to wire up to existing R logic the application is done. This is what I set out to put to the test now:
The scenario
As I wanted to see how far I can go (Walter from Fringe once claimed one would not know how far one can go until one went too far - dangerous, but in this context, there is little potential for harm, so let’s try). So I decided to go beyond just displaying data (though I’ll do that as well) and create logic for modifying data (like adding tasks and checking them as ‘done’). My scenario is:
- two panes
- left side a task list with checkboxes for done plus a text+button to add new ones
- right side a pie showing how many tasks are done already (VS open)
It’s not the most uncommon or ingenious task, but it contains it all:
- pulling data (here: JSON from CouchDB)
- writing data as in reacting to events and updating the ui (new tasks or tasks checked as ‘done’; here: JSON to CouchDB)
- visualization (the pie with done VS open)
implementing it
First, I need some libraries: foremost httr and jsonlite to connect to CouchDB and parse the resultant JSON into R lists. Plus of course shiny itself.
library(jsonlite)
library(shiny)
library(httr)
As I want to process JSON in a way that write(read(someJsonString)) is equal to someJsonString (i.e. no magic along the way) I define some utility functions to do just that (avoid automatic transformations):
fromJSONVerbatim <- function(what) {
  fromJSON(what, simplifyVector = FALSE)
}
toJSONVerbatim <- function(what) {
  toJSON(what, auto_unbox = TRUE)
}
So now, I can check if I have an (empty) database and create it otherwise. CouchDB works in such a way that everything (databases, documents, queries a.k.a. views, etc.) are HTTP endpoints to be used with GET, POST, PUT and the like. So, the database has an endpoint http(s)://server:port/dbname. When the database exists it gives some info on the database. If it does not exist CouchDB returns 404. When that happens, I submit a PUT to http(s)://server:port/dbname to create the DB. When you set a password for your CouchDB (vital for all but development bound to localhost only), you need to add calls to *authenticate of httr. Analogous to the database itself, I can use endpoints for documents: http(s)://server:port/dbname/docid retrieves a document, PUT to http(s)://server:port/dbname/docid with some JSON updates (or creates) a document with a known ID and POST to http(s)://server:port/dbname creates a new document with a new (generated) ID. By the way: CouchDB sends a revision with each document and expects it back for updates. By checking for revision mismatches, CouchDB implements optimistic locking (and peer-to-peer repliaction).
Anyways: I need methods to create the DB and to fetch, create and update tasks in CouchDB:
dbUrl <- "http://127.0.0.1:5984/shiny"
dbInfo <- try({
  url(dbUrl)
}, silent = TRUE)
if ("try-error" == class(dbInfo)) {
  PUT(url = dbUrl)
}

todos <- list()
fetchTodos <- function() {
  todos <<- lapply(fromJSONVerbatim(url(
    paste0(dbUrl, "/_all_docs?include_docs=true")
  ))$rows, function(r) {
    r$doc
  })
}
postTodo <- function(title) {
  #...
}
completeTodo <- function(doc) {
  #...
}
fetchTodos queries CouchDB for a list of all documents (in larger scenarios, it would poss. be a view). CouchDB returns a JSON object with roughly this structure (there are some other attributes I don’t need at this point):
{"rows": [
  {"doc": {"_id": <docid>, "_rev": <docrev>, <myattr>: <myval>}}
]}
Each document has an _id (unique within the database), a _rev giving number and hash of the revision and any JSON I want to have (can even be different in every doc). For now, I go for:
{"_id": <docid>, "_rev": <docrev>, "title": <stringval>, "done": true/false}
e.g.:
{"_id": "abc123", "_rev": "1-def456", "title": "Test CouchDB", "done": false}
With fromJSONVerbatim I can go now and translate this into an R list which looks like this:
$rows
$rows[[1]]
$rows[[1]]$doc
$rows[[1]]$doc$`_id`
[1] "abc123"

$rows[[1]]$doc$`_rev`
[1] "1-def456"

$rows[[1]]$doc$title
[1] "Test CouchDB"

$rows[[1]]$doc$done
[1] FALSE
In fetchTodos, I simplify the list to kick out info I don’t need, but with or without simplification, I can now use R to access my data (varname is todos):
todos$rows[[1]]is the first row (i <- 1; todos$rows[[i]]would also do)length(todos$rows)gets me the count of rowstodos$rows[[1]]$doc$titlegets the title (likewise:todos$rows[[1]]$doc$donefor done)todos$rows[[1]]$doc$done <- TRUEsets the task donelapply(c(1:length(todos$rows)), function(i) {}loops over all indexes of docs (likelapply(todos$rows, function(r) {}would loop over all rows)- (and by using
toJSONVerbatim(todos)(ortoJSONVerbatim(todos[[1]]$doc)) I can go back from R to JSON)
Analogous to fetchTodos, there’s methods to post new / update done state:
postTodo <- function(title) {
  tmplte <- fromJSONVerbatim('{"title": "", "done": false}')
  tmplte$title <- title
  POST(url = dbUrl,
       body = toJSONVerbatim(tmplte),
       content_type_json())
}
completeTodo <- function(doc) {
  doc$done <- TRUE
  PUT(url = paste0(dbUrl, "/", doc$`_id`),
      body = toJSONVerbatim(doc),
      content_type_json())
}
postTodo creates a new document strucutre and POSTs it (having CouchDB generate an ID); completeTodo changes an existing document and PUTs it (as long as the _rev is correct, CouchDB will update. After both, I fetch the list of documents again (now with updated info).
Shiny-UI
So, I got everything in place to work with my data - I can go for the ui next. This is quite compact:
fetchAndShowTodos <- function(input, output, session) {
  #...
}

shinyApp(
  ui = fluidPage(flowLayout(
    verticalLayout(
      tags$div(id = "todos"),
      verticalLayout(
        textInput("newTitle", label = "New Todo: "),
        actionButton("addNew", label = "Add")
      )
    ),
    plotOutput("pie", width = 300, height = 300)
  )),
  server = function(input, output, session) {
    fetchAndShowTodos(input, output, session)
    observeEvent(input$addNew, {
      if (nchar(input$newTitle) > 0) {
        postTodo(input$newTitle)
        updateTextInput(session, "newTitle", value = "")
        fetchAndShowTodos(input, output, session)
      }
    })
  }
)
it creates a hierarchy of nested layouts (ui) and a specification on how to initialize and react to events (server). Right now, there is
- a container for a dynamic list of todos (created via insertUI within
fetchAndShowTodos). ID (also in HTML) is todos. - a text input for a new todo. ID (also in HTML) is newTitle.
- a button to trigger the creation of a new todo. ID (also in HTML) is addNew.
- calling
fetchAndShowTodoson opening the page - reacting to a click on addNew, triggering a new todo doc POSTed to CouchDB
Finally, I need a method to fetch and show a dynamic list of todos including checkboxes:
observeCount <- 0
showTodos <- function(input, output, session) {
  removeUI("#todos *", immediate = TRUE, multiple = TRUE)
  lapply(c(1:length(todos)), function(i) {
    insertUI(
      "#todos",
      ui = checkboxInput(
        paste0("done", i),
        label = as.character(todos[[i]]$title),
        value = as.logical(todos[[i]]$done)
      ),
      where = "beforeEnd"
    )
    if (i >= observeCount) {
      observeEvent(input[[paste0("done", i)]], {
        if (input[[paste0("done", i)]] & (!todos[[i]]$done)) {
          completeTodo(todos[[i]])
          fetchAndShowTodos(input, output, session)
        } else {
          updateCheckboxInput(session, paste0("done", i), value = todos[[i]]$done)
        }
      }, ignoreInit = TRUE)
      observeCount <<- observeCount + 1
    }
  })
  # will draw a pie chart here in just a sec...
}
fetchAndShowTodos <- function(input, output, session) {
  fetchTodos()
  showTodos(input, output, session)
}
I could probably write a book on this one alone, but it doesn’t really matter: this is where it gets awkward and to be fair, I just leave the use case of Shiny. Let’s just say that more than a little interaction is in much better hands when doing ReactJS (just being a little biased here - there’s lots of other great frameworks). Within above code, I empty the todos div, loop over all todo documents, create a checkbox along with an event handler that triggers completion (and disallows unchecking it again).
Charts
The task Shiny does a fantastic job with is drawing charts. They’re not interactive - rather, the raster image is shown (much like drawing to the PNG device), but they’re super-simple and look as great as one can make them in R (which is great). Here, I just create some very simple pie counting how many tasks are done (VS open). The essential part is assigning output$pie below - I use the standard R pie function just like I would in the R console:
showTodos <- function(input, output, session) {
  #...
  df <-
    data.frame(status = unlist(lapply(todos, function(r) {
      if (r$done)
        'done'
      else
        'open'
    })), cnt = c(1))
  dfAgg <- aggregate(cnt ~ status, df, FUN = sum)
  output$pie <- renderPlot(pie(dfAgg$cnt, labels = dfAgg$status, radius=1))
}
Styling and tweaking
The other part where Shiny is really smart: adding custom HTML. This really allows to tweak the remaining 10%, and as a web dev, I really like doing this with the tech I know and love. Here’s how to reduce whitespace around the pie chart and put a dashed border around it (the IDs used w/in Shiny are always also the IDs in HTML):
shinyApp(
  ui = fluidPage(HTML('<style type="text/css">#pie {border: 2px dashed lightgrey; overflow: hidden; } #pie img {margin: -10px; }</style>'), flowLayout(
    verticalLayout(
      #...
And that’s really it, I’m done! This is how it looks like:
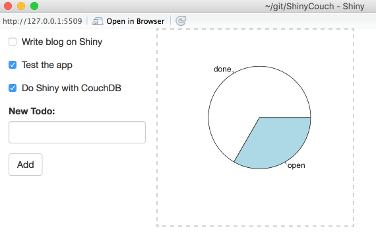
I’ve put this into a github repo - feel free to play with it and let me know what you think!
So?
For visualization and computation, Shiny is amazing. To me, Shiny is just smart in allowing Web developers to add custom code where necessary while still providing a great fast path to a nice-looking UI. As it’s open source, people might just have added the freedoms they wanted (and that’s awesome).
The fact that plots are per se static (raster images) is not so surprising - and in fact, the existing plot libs (that produce rasters) might be a reason to use R/Shiny in the first place. Guess it’s just fair enough to go for JavaScript when a nice and interactive UI is required. And it’s not even that hard - I did an example for pie charts.
The only thing that just does not really work smoothly: writing back into the database. For very small cases, my way of just triggering writes will probably carry if you’re really willing to take the risk. For instance: leaving out ignoreInit auto-checked all items done on app start. It took some time (and care) to really become stable here. So, for For all cases beyond very small, it might get painful. But to be fair: that’s just not the use case Shiny was built for.
That’s visualization and dashboard - and for those, Shiny just really shines. It’s amazingly simple to produce something touchable and get info out (and to tweak a little to make it look the way I want). Using RStudio makes all of this a lot easier as well - not just b/c of code completion, but b/c of reliably killing the webserver process. Anyways, it’s fun to work with.