Creating Spreadsheet summaries
This is like an evergreen topic that crossed my way so many times in one form or the other that I decided to just do a brief writeup on it, for whatever it’s worth: Spreadsheets are cool because they’re empowering - they give everyone the chance to create. And it’s quick to just to JFDI-implement them.
The point is: just getting started works nicely, for capturing info as well as for later analysis - until it gets too much for one file. So, there is a natural limit in between: what to do with several complex offer calculations (like for projects) or with several time sheets, etc. Getting one offer calculated is nice & easy; and analyzing aggregate data for several offers is nice and easy as well - just how get summary info from several offers together into one file?
One natural response is like “OK, it takes something bigger - like a database or something in the cloud”. This is quite valid - but a little discouraging for everyone that really likes Spreadsheets and the JFDI-workstyle coming with it (btw: urban dictionary will help you out on ‘JFDI’). And having worked on many cases where Spreadsheets could either have done all but this ‘summarize it’ part - or where I just flat-out missed the summary: I set out to actually find out: how can one summarize several Spreadsheets into one? How can one solve this bottleneck? (esp. as all before and after is perfectly ready and joyful to use).
So…
option #1: using R
R is popular in analytics / data science because of incredible breadth and depth of functionality plus an amazing community around the language. There are packages like readxl to get a data frame out of a Spreadsheet file. As dir gets a vector with all files in a directory and read_xls or read_xlsx does the reading, it basically boils down to
fles <- dir(pattern="some*.xls")
dfx <- read_xls(fle, sheet="Sheet1", range="A1:B4")
rbind(df1, df2)
The result is one data frame with the summary of all the sheets in question. On can go on writing the result to CSV and use that in e.g. a Spreadsheet-based Pivot Table via External Data Sources. In Excel there is an ODBC-Driver for CSV that offers each file in a folder as table of a virtual “database”. That can be used to create an External Source. That External Source is then ready to create a Pivot Table.
For LibreOffice, it’s a little non-obvious, but also possible: first, create a new database via File > New > Database and choose Connect to an existing database of type Text. LibreOffice then asks pretty much the same questions that come up when opening one CSV in Calc. Just like the Excel counterpart, one has to choose a folder - and all files of it become a table each of a virtual “database”. In the last page of the wizard, opt to register the database and save the resultant database file (basically just meta-info) somewhere. Final step after all of this is (within Calc) creating a Pivot Table via Data > Pivot Table > Create… and choose a Data source registered in LibreOffice as the selection - namely the database created before.
Or, alternatively, one can use R itself, poss. with Shiny (see also Shiny 4 real) or RMarkdown / knitr to make it nice.
By the way (though I did not try that one), there is also a package to read Open Document Spreadsheet (ODS) files called readODS.
Anyways: the summary is there, right at the fingertips. And by the way: I’m not aware of a library to actually update an existing Spreadsheet file (above alternatives need to cut it - and they do).
Quite like R (but kinda out of fashion) is
option #2: using Macros
(a.k.a. some kind of Basic, with capital B, programming). It worked (quite well even - and there’s tons of documentation), but it didn’t age well: the tools / IDE for it didn’t see much love for at least a decade, it’s cumbersome and just old. Secondly, Macros don’t translate between tools - so using Excel and friends along with e.g. LibreOffice is out. Third off (and most importantly): any diligent organization bans Macros. Without exception. Period. In this time, where online security and literacy about how to stay safe online is just a must, one can’t allow untrusted code to run upon opening a document. And no, no average person without technical background can really judge whether or not to “run Macros for this document”. And vendors reacted: there’s group policies to just ban Macros. If our organization didn’t yet implement that or sth similar: insist! All overall: Macros are pretty much out. They had their time - and that time has passed.
Option #3 is the easiest - and it’s so simple and so straightforward that it almost hurts. I just didn’t know about it for a long time, but I’m out to change that, because really everyone can use it, and use it safely. It just becomes somewhat impractical with a very large number of files - yet it carries quite far. This option is - drummmmms -
option #3: Linked data
This is how it works: Open both the summary sheet and the detail sheet(s), in the summary sheet, type “=”, switch to the detail sheet and select some cells. Excel (and LibreOffice) create sth along the line of ='file:///Users/sebastianrothbucher/Documents/sheet1.ods'#$Sheet1.B1. There’s some more info for Excel and for LibreOffice. As no special features are used, this works between programs: a file can be edited with LibreOffice, Excel and LibreOffice again; LibreOffice users can create summaries of Excel data and vice versa.
And that’s it, really! Any Spreadsheet (i.e. Excel / LibreOffice) keeps a list of Linked Data (in LibreOffice via Edit > Links…) - so whenever an updated details file comes in, the summary can be updated with one click. At least LibreOffice even allows using INDIRECT to build the reference formula via formula (though this is not at all needed to get started - and maybe a little crazy as a starting point, too). In the end, there’s no need for any database or custom programming set up (or cloud plan purchased) - plain JFDI does the trick.
All three methods need a folder with all files in it, but not necessarily a file share or something - it’s enough for people to mail in updates or to download new files from some online storage.
By the way: Google Sheets as online-only suite offers something similar via a function called IMPORTRANGE.
Sample scenario
Just to push this a little further: here’s a simple scenario that probably everyone who’s worked in professional services some point in time can relate: projects are calculated based on efforts, milestones, uplifts, contingencies, etc. - after some time with a rather elaborate Spreadsheet that evolves. It’s one file per project, and the aim is to just draw a summary over all projects. For the rest of this post, I’ll basically go through different techniques using R and LibreOffice (both are open source) to just get this scenario going.
Basically, every project is one file with at least these tabs:

(where esp. DetailCalc might be pretty extensive).
Anyways, all shets are expected to have a summary tab similar to this one:
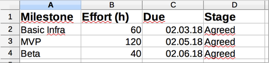
Again, there is no real surprise here. Most project managers will probably set Stage (like RFP / Proposed / Agreed / Signed / …) similar for all parts - but we don’t depend on it. Point is: the summary sheet needs to be similar in all files.
using option #1 - R
now, the following code reads all details_…xlsx files in the directory and constructs a data.frame from them (taking up to five rows, possibly less):
library(readxl)
library(lubridate)
all <- NULL
for (fle in Filter(function(fle) grep("details_.+", fle), dir(pattern="*.xlsx"))) {
  one <- as.data.frame(read_xlsx(fle, sheet="Summary", range="A2:D6", col_names=FALSE))
  colnames(one) <- c("Milestone", "Effort", "Due", "Stage")
  one$Project <- sub("details_(.+)\\.xlsx", "\\1", fle)
  all <- (if (!is.null(all)) rbind(all, one) else one)
}
all <- all[(!is.na(all$Milestone)),]
This gives a data.frame with five cols (Milestone, Effort, Due, Stage and Project). Pls. observe that col_names needs to be FALSE in order to avoid accidentally cutting off the first record.
Anyways: here is how the data frame all looks like for two projects with three milestones each:
    Milestone Effort        Due    Stage  Project
1 Basic Infra     60 2018-03-02   Agreed Project1
2         MVP    120 2018-05-02   Agreed Project1
3        Beta     40 2018-06-02   Agreed Project1
6 Basic Infra     20 2018-03-03 Proposed Project2
7         MVP     40 2018-04-03 Proposed Project2
8        Beta     30 2018-06-03 Proposed Project2
This can be used to draw summaries - like effort by month via
all$Due_month <- format(all$Due, '%Y-%m')
agg <- aggregate(Effort~Due_month, all, FUN=sum)
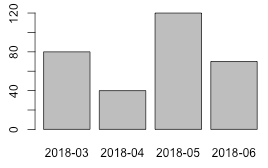
barplot(agg$Effort, names.arg=agg$Due_month)
Which produces agg:
  Due_month Effort
1   2018-03     80
2   2018-04     40
3   2018-05    120
4   2018-06     70
and the following plot:
R to CSV
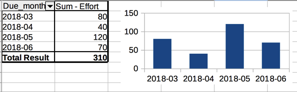
Via write.csv(all, file="all.csv") or write.csv(agg, file="agg.csv") one can get a CSV file to be used as database to then create a Pivot Table (here is one based on all):
It’s not not far to automate the CSV file generation step by invoking R via a script called with Rscript summary.R (with summary.R containing all the above commands except barplot).
R with Shiny
Alternatively, having the agg data frame in place anyway, it’s also not far to a Shiny app (or to use knitting). Here is how to produce a Shiny app (it needs the code from above except for barplot):
library(shiny)
# (summary code here)
shinyApp(ui = splitLayout(
    tableOutput("tab"),
    plotOutput("plt"), cellWidths=c('30%', '70%')
  ), server=function(input, output){
    output$tab <- renderTable(agg)
    output$plt <- renderPlot(barplot(agg$Effort, names.arg=agg$Due_month))
 }
)
It’s not exactly a lot of code to get it all working; here’s what it looks like:
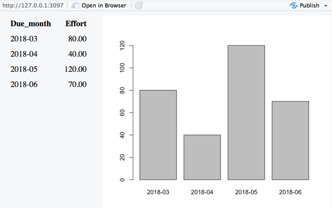
I put all R code into a gist ready to run.
(It’s safe to discard option #2 - the macros), so finally, it’s
using option #3 - Linked data
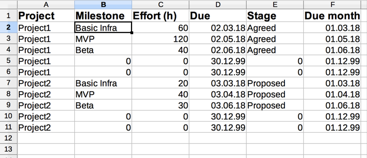
As mentioned before, this is actually shamefully simple: I open the detail project files (at least the ones I want to add now) plus a new Spreadsheet. I create the same cols each Summary sheet has plus one for the project name. I end up w/ something like this:

Then, again assuming there’s a maximum of five milestones per project, I add ‘Project 1’ to five columns, set the cursor in the milestone col of the first row of ‘Project 1’, type an equals (=), switch to the ‘Project 1’ worksheet, and click the milestone cell of the first row there. It creates a link like this

As the remaining columns match, I can auto-fill the remaining cells with copy and paste / the fill cursor and end up with this (Rinse and repeat for all projects). As I want to go per month, I calculate another Due month col as =D2-DAY(D2)+1 which gives me the first of the respective month. In the end, I get:
And that’s it! I have all the data I need in one place.
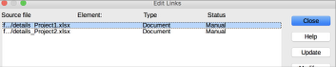
When opening the Edit > Links… dialog, I can trigger updates (and see which files I included already):
As I have one sheet with all summary info of all projects now, I can again go and create a pivot (plus diagram) with a range going into the 100th row or below:
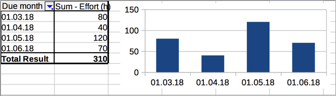
(Excluding December off 99 aka empty rows in imported summaries and genuinely empty rows gives the very clean view.)
And in fact, I can create a summary .ods file (OpenOffice.org / LIbreOffice Spreadsheet) with inputs from .xlsx files (Excel Spreadsheet) and others at the same time - so people really have the freedom to use the tools they like.
Summary / Wrap-up
To wrap this up: every empowered team can just get going with nothing but curiosity and a couple downloads (both R and LibreOffice are open source). The Monocle Guide to Good Business - though in a slightly different context - points out that one would “normally need less than they tell”, which is just as true here. I kind of should have digged that deeply before - but at least now I did.
While researching all this as I wrote along (and seeing more and more of my past mysteries dissolve), the post became quite extensive.
Anyways, for what it’s worth, here’s the description of how to work together on large(r) scale/complexity and generally extensive endeavors using just Spreadsheets - I hope you found it useful. As ever, let me know what you think!